Q3 2026 Economic and Market Review
Q3 2026 Economic and Market Review Uncertainty persisted through the third quarter of 2026 as the conflict with Iran continued with no clear end in sight. The nearing midterms contributed to the uncertainty. We.

Q3 2026 Economic and Market Review Uncertainty persisted through the third quarter of 2026 as the conflict with Iran continued with no clear end in sight. The nearing midterms contributed to the uncertainty. We.

Uncertainty persisted through the third quarter of 2026 as the conflict with Iran continued with no clear end in sight. The nearing midterms contributed to the uncertainty. We are publishing this on election day, November 3, 2026, with a wide range of possible outcomes on the horizon. No one can know in advance how any election will turn out. We can, however, make a plan to vote and look to the past for examples of what might follow. In this letter, we look at how markets have historically responded to midterm elections and share what the economic data are telling us and what we are seeing in the stock market. We also share some trends in clean energy that we see as signs of progress and hope will have a positive long-term impact in helping address climate change.
Last quarter, we noted that markets have tended to pause heading into midterm elections, as investors wait to see how policy, budgets, and spending might change. The historical record shows that midterm years have often brought market volatility in the months before the vote. However, the data in recent decades demonstrates that on average stocks have tended to rise once results are known and policy uncertainty fades.
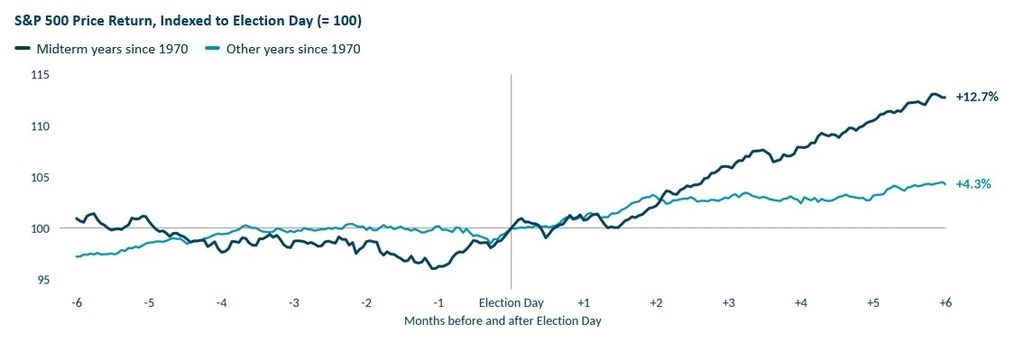
Our firm’s analysis of historical data showed us that over the period since 1970, the S&P 500 has gained an average of nearly 13% in the six months after a midterm election, compared with 4.3% in other years. It was higher six months after each of the 14 midterms that have taken place since 1970.1 Historical returns are not indicative of future returns. That said, we believe it is prudent to keep long-term assets invested despite expected market volatility prior to the midterm elections.
The mood of the country seems to remain dour, as reflected by consumer sentiment surveys, which are impacted by inflation and current market conditions, but there are positive stories that can be read in the economic data.
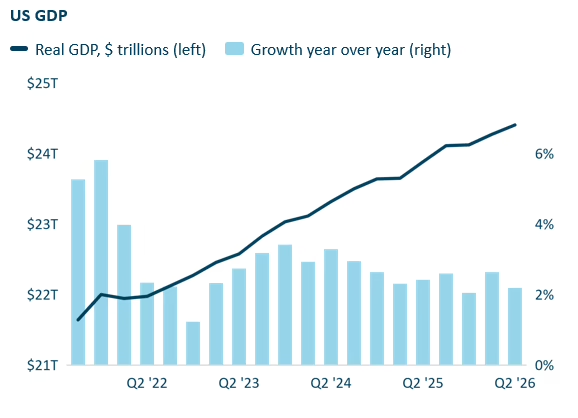
Real GDP, which adjusts for inflation, was 2.2% higher in the second quarter than a year earlier.2 Consumers have kept spending despite higher prices, and wealth creation has continued as well. US companies raised a record $146 billion through initial public offerings in 2026 through early September, a sign that investors remain willing to fund growing businesses.3
There are softer spots. The Personal Consumption Expenditures (PCE) price index, the Fed’s preferred inflation measure, showed an increase of 0.5% in September.4 Hiring slowed sharply over the summer. Employers added 29,000 jobs in September, and the unemployment rate rose to 4.2%.5 Consumer prices rose 3.4% over the past year, lifted by higher energy costs tied to disruptions in the Strait of Hormuz, and prices have risen slightly faster than wages.6 The gains have also not been shared evenly.
Economists call the current pattern a K-shaped recovery, in which higher-income households continue to do well while lower-income households feel rising prices more sharply. We first covered the social impact of the K-shaped economy in our Q4 2025 Economic and Market Update and continue to watch this closely, as we believe a broader slowdown would have the greatest negative impact on the under-resourced communities that many of our clients’ impact investments aim to support. For now, the economy is still growing, and that matters for those communities too.
Last quarter, we noted that the Fed’s outlook had become more hawkish (more focused on fighting inflation than on stimulating growth), with half of the Fed’s policymakers expecting at least one rate hike this year. In September, the Fed followed through, raising its benchmark rate for the first time since 2023 to a range of 3.75% to 4.00%.7 In our view, the decision shows the Fed acting on its mandate for stable prices, consistent with the independence markets have continued to price in.
The Treasury yield curve chart shows the year in three snapshots. From the end of 2025 to the end of June, hopes for rate cuts faded and shifted to potential rate increases due to persistent inflation driven by the Iran conflict, and yields beyond the shortest maturities rose and the curve flattened.
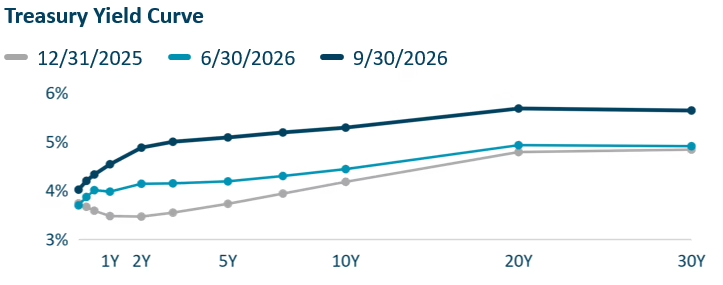
From June to September, the curve moved up again across maturities and steepened. By September 30, the 10-year Treasury yield reached 5.3%, its highest level since 2002.8 As we explained last quarter, mortgages and car loans follow the 10-year yield more closely than the overnight rate the Fed sets, so borrowing costs are likely to stay elevated even if the Fed pauses. Markets are currently pricing in two or three more hikes over the next year.
Rising yields pushed many bond indexes into negative territory for the quarter. They also mean that cash and newly purchased bonds now pay more income than they have in years.
With stocks near record levels, it is fair to ask whether prices have gotten ahead of reality. We believe earnings are a large part of the answer. In our Q2 2026 Economic and Market Review, we reported that S&P 500 earnings grew 28.6% year over year in the first quarter, the fastest pace since 2021. That trend has continued with profits driven largely by spending on AI infrastructure and steady consumer demand.
Rising prices backed by rising earnings rest on firmer ground than enthusiasm alone. Today’s stock prices do assume that strong earnings growth continues, and higher interest rates and a cooling job market could make that harder to sustain. We are watching third-quarter results, which companies report through October and November, to see whether that growth holds.
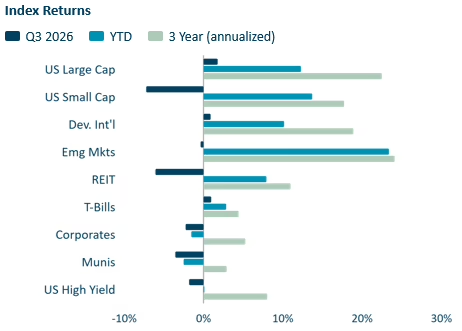
The S&P 500 gained 2.3% in the third quarter and was up 12.7% through September 30th, 2026.9 Earlier in the year, market breadth improved. In the second quarter, the Russell 2000 small-cap index reached an all-time high and value-oriented companies performed well. In the third quarter, leadership narrowed again. Investors rotated back into the largest technology companies with the Nasdaq up 2.6%. The Russell 2000 fell 7.2% as higher rates weighed on smaller companies, though small caps performed better than large caps for the year.10 Energy was the top-performing sector in the quarter as supply disruptions lifted oil prices, and technology and health care also posted solid gains. Higher interest rates impacted rate-sensitive businesses and Consumer Discretionary fell. Emerging markets dipped as chipmakers in Taiwan and South Korea pulled back after a strong first half, but they remain ahead of the other major indexes for the year.11
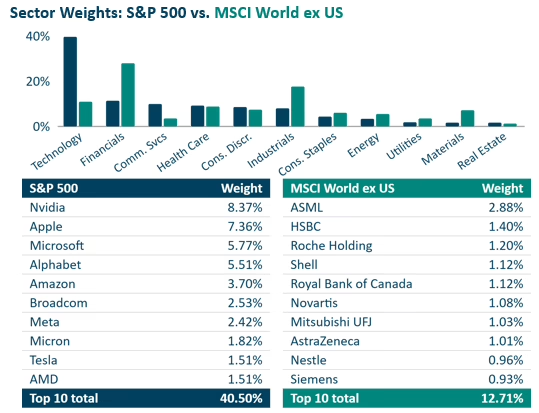
Concentration in the US stock market has risen again as the technology sector outperformed on AI exuberance. The ten largest companies in the S&P 500 are all technology or tech-related, and together they now make up 40.5% of the index, up from 37.8% at the end of June.12 Chipmaker AMD has joined the top ten in place of Eli Lilly, so four of the ten largest companies (Nvidia, Broadcom, Micron, and AMD) now make semiconductors. In the MSCI World ex US index, by contrast, the ten largest holdings span technology, financials, health care, energy, consumer staples, and industrials, and make up 12.7% of the index.13 As we noted last quarter, diversification still exists. You just have to look beyond the S&P 500 to find it.
Investors are becoming more selective about which AI companies they reward. Last quarter, we showed that only two of the Magnificent 7 (Apple, Microsoft, Alphabet, Amazon, Meta, Nvidia, and Tesla) beat the S&P 500 from the start of 2025 through June 2026. The same split holds for 2026 so far. Through September 30, Apple and Nvidia were each up 22.5% on a price basis, ahead of the S&P 500’s 11.8%. Alphabet, Meta, Amazon, and Microsoft trailed the index, and Tesla fell 21.1%.15
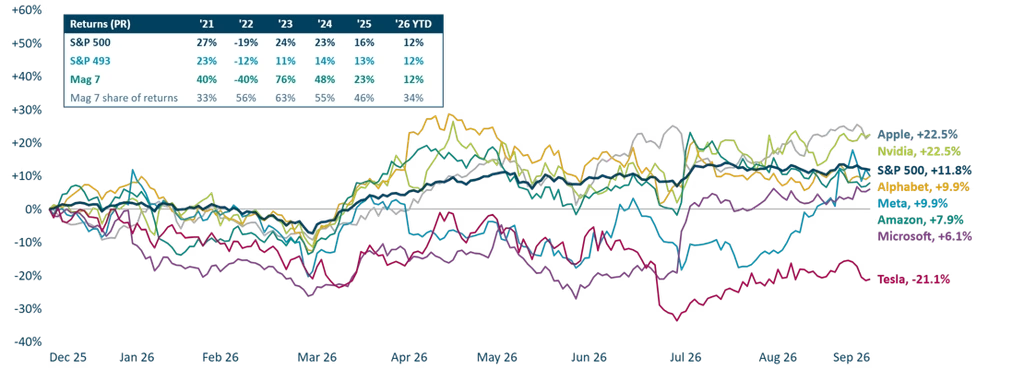
As a group, the Magnificent 7 have gained about 12% this year, roughly in line with the other 493 companies in the index. In 2023, the group accounted for 63% of the S&P 500’s return. This year, its share is 34%.16 The largest companies are no longer carrying the index on their own, even as their combined weight in it grows. Leadership can also shift quickly. Meta’s shares rallied sharply from mid-August into September, following the launch of its new AI agent.18
Disruptions to oil supplies have run through much of this year. We believe the impact of the war on oil and gas prices reinforces the need for energy security and diversification, especially renewable sources of energy over the long term. A decade after the Paris Agreement, the data give reason for cautious optimism.19
Demand has not gone away, despite changes in policy. In the US, EV sales are down from last year after federal tax credits ended, but they have stabilized, and hybrid sales are up significantly.20 Abroad, EVs now account for over 60% of new-car sales in China21 and about 30% in Europe.22 Clean energy investment also appears on pace for another strong year in 2026 with solar, battery storage, and wind accounting for 93% of all planned additions and natural gas only making up 7%.23 Texas leads with 40% of all new solar and 53% of battery storage capacity being added in the US, despite the rhetoric and policy pullback at the federal level.
Much work remains. Global greenhouse gas emissions are still rising, and tropical forest loss has increased over the past decade.24 We see the investment and adoption trends as evidence that the energy transition has real momentum.
Uncertainty remains around the conflict with Iran, the path of inflation and interest rates, and the outcome of the midterms. We expect these factors to keep markets volatile in the months ahead. At the same time, the economy is still growing, corporate earnings remain strong, and history suggests that election-year uncertainty has tended to fade once results are known.
We believe this environment favors diversification and patience. With a small number of large companies driving so much of the US market, a portfolio diversified across market cap, sectors, and regions is designed to reduce reliance on any one part of the market. For clients with spending needs in the coming year, keeping an appropriate cash reserve can help you avoid selling investments at an inconvenient time. We remain focused on your long-term goals rather than short-term market moves.
Between now and year end, we will be paying close attention to interest rates. At its October 27, 2026 meeting, the Fed voted to hold interest rates steady,25 but with inflation persistent and rising, many market participants are expecting to see a rate hike before the end of December.26 Your advisory team is ready to talk through what this means for your own plans.
As always, we welcome your questions.
Jane Swan is a Partner, Senior Advisor, and Chief Advisory Officer at Veris, and she holds the Chartered Financial Analyst (CFA®) designation. Bio.
Roraj Pradhananga is a Partner and Chief Investment Officer at Veris and a Certified Investment Management Analyst (CIMA®) and Certified Public Accountant (CPA). Bio.
1. Veris analysis of S&P 500 daily price data, 1970 to 2026 Price return excludes dividends.
2. U.S. Bureau of Economic Analysis; FRED.
3. Renaissance Capital.
4. https://www.bea.gov/news/2026/personal-income-and-outlays-september-2026
5. U.S. Bureau of Labor Statistics.
6. U.S. Bureau of Labor Statistics.
7. Federal Reserve.
8. U.S. Department of the Treasury.
9. eVestment; FRED. Index returns are total returns, including dividends.
10. eVestment; FRED. Index returns are total returns, including dividends.
11. eVestment; FRED. Index returns are total returns, including dividends.
12. iShares, IVV holdings (September 2026); MSCI, World ex USA factsheet (September 2026).
13. iShares, IVV holdings (September 2026); MSCI, World ex USA factsheet (September 2026).
14. eVestment; iShares, IVV holdings (September 2026); MSCI, World ex USA factsheet (September 2026)
15. Massive.com market data; S&P Dow Jones Indices; J.P. Morgan Asset Management. Price returns through September 30, 2026.
16. Massive.com market data; S&P Dow Jones Indices; J.P. Morgan Asset Management. Price returns through September 30, 2026.
17. Massive.com market data, S&P Dow Jones Indices, J.P. Morgan Asset Management. Price returns through September 30, 2026.
18. https://apnews.com/article/meta-muse-ai-agent-3a4572eb4cf4e95d8a0dfdad6e6ca065
19. Generation Investment Management, The Sustainability Trends Report 2026 (September 2026), drawing on data from the IEA, Ember, Climate Action Tracker, and World Resources Institute. Most recent year shown for each indicator.
20. https://www.npr.org/2026/09/30/nx-s1-5979915/ev-hybrid-sales-2026-federal-tax-credit
21. https://www.carbonbrief.org/chart-a-record-two-thirds-of-car-sales-in-china-are-now-electric-vehicles
22. https://www.jato.com/resources/media-and-press-releases/bevs-account-for-30-of-all-new-cars-sold-in-europe-in-september-2026
23. https://www.iea.org/reports/world-energy-investment-2026/regional-dashboards?region=United+States
24. Generation Investment Management, The Sustainability Trends Report 2026 (September 2026), drawing on data from the IEA, Ember, Climate Action Tracker, and World Resources Institute. Most recent year shown for each indicator.
25. https://www.federalreserve.gov/newsevents/pressreleases/monetary20261028a.htm
26. https://www.reuters.com/business/feds-musalem-says-rate-hike-is-needed-soon-2026-10-30/
The information contained herein is provided for informational purposes only and should not be construed as the provision of personalized investment advice, or an offer to sell or the solicitation of any offer to buy any securities. Rather, the contents including, without limitation, any forecasts and projections, simply reflect the opinions and views of the authors. All expressions of opinion reflect the judgment of the authors as of the date of publication and are subject to change without notice. There is no guarantee that the views and opinions expressed herein will come to pass. Additionally, this document contains information derived from third-party sources. Although we believe these third-party sources to be reliable, we make no representations as to the accuracy or completeness of any information derived from such third-party sources and take no responsibility, therefore. Information related to the performance of certain benchmark indices is provided for illustrative purposes only as investors cannot invest directly in an index. Past performance is not indicative of or a guarantee of future results. Investing involves risk, including the potential loss of all amounts invested. The information contained in this document also contains certain forward-looking statements, often characterized by words such as “believes,” “anticipates,” “could,” “plans,” “expects,” “projects,” and other similar words that indicate future possibilities. Due to known and unknown risks, other uncertainties and factors, actual results may differ materially from the expectations portrayed in such forward-looking statements.